


Asset managers are still not properly able to represent the true and comparative value-for-money they provide
In 2015, the UK’s financial regulator, the Financial Conduct Authority (FCA), launched its controversial asset management market study and quickly concluded that the asset management market was, at least in part, impacted by poor price competition.
As part of a package of measures to counter this market failure, it implemented a follow-up enquiry that introduced a best-practice data-standard for the costs associated with asset management products, matched to the net and gross returns of these products… and the Value-for-Money (VfM) standard that is the Cost Transparency Initiative (CTI) was born.
I led this investigation, wrote the CTI standard and the FCA report that contained it, and happily moved on from the enquiry after what was over a year of tough, pro-bono graft. Sadly, my respite didn’t last long as I was inundated with requests from institutional asset owners for help in obtaining, validating and interpreting CTI data from their managers.
I quickly hit my capacity and was forced to build a platform to collect, collate and analyse the data, and that company became ClearGlass. Now, some five years later, I have access to a wealth of data that makes even me sometimes sit up in surprise. I know the true cost and performance of private markets funds, for example, and I have data that shows the actual extent of liability-driven investment (LDI) usage and exposure in the UK and was able to feed that into the investigations of the UK LDI crisis.
But what has surprised me most is how the institutional asset management market is still not functioning properly. The truth about a market where competition is not working is that buyers cannot properly identify the VfM they receive from vendors and, of perhaps more importance, vendors cannot properly present themselves as delivering good VfM.
In other words, clients buy the wrong things, and sellers lose out on deals they should have rightly won. To translate this to the world of asset management, managers are still not properly able to represent the true and comparative VfM they provide, and asset owners are not able to properly understand the VfM their incumbent managers provide, or easily differentiate between managers at point of selection.

I have numbers to back this up. ClearGlass has collected data for over 1,000 asset owners, mostly defined benefit (DB) pension schemes, from over 530 asset managers and for almost 100% of these schemes there is at least one portfolio that is not only expensive compared to the ongoing charge benchmarks we calculate, but is underperforming over the long term (five-year annualised performance).
Average 8bps of headline costs
There are exceptions of course. Last month I wrote about Border to Coast Pension Partnership being really the only asset owner I know that has no opportunities to reduce manager fees as its manager selection and fee negotiation is so good. Border to Coast aside, most schemes have an average 8bps of headline costs (ongoing charges) that they could negotiate down, should they put in the effort and use the correct data.
But herein lies the rub. For schemes to achieve this 8bps headline cost reduction, equivalent to reducing headline costs by a staggering 20-25% overnight and in perpetuity, means managers must give up 8bps of fee income. Or do they? Because the truth is that not every manager will be impacted; only those with fees that are too high, along with performance that is too low, should rightly be challenged.
As our benchmarks are set at median levels, this means that for any given asset class half the market is more expensive than expectation and half the market less expensive.
The theory would be that in a truly price competitive market, assets would move from expensive managers within a strategy, to less expensive ones – the less expensive ones would win the market share of those that are more expensive. Of course, it is always about more than cost but, even so, statistically 25% of the market will still have simultaneously better than expected ongoing charges whilst also giving better than expected performance.
Actually, more managers that just this exceptional 25% can capture this opportunity, as there are also 25% of managers who offer better than expected performance but are more expensive than expectation, and they can win by simply lowering their fees, if only they knew they were expensive and knew where the market price actually was.
So the answer is, in a price competitive market, 25% of managers are already right priced with the right performance, and a further 25% of the market can become both right priced with the right performance by dint of dropping fees. The market belongs to them if they are open and can prove their competitive advantage.
‘Right performance, right price’
And what is the size of the prize for these managers? At ClearGlass we benchmark 63 different strategies, which cover almost all strategies used by UK DB schemes, and estimate the ‘manager opportunity’ for each strategy.
And the answer is that for the market to be properly competitive, the ‘right performance, right price’ managers should win over £500bn in assets under management (AUM) from their underwhelming competitors across all the different strategies.
To win this £500bn AUM, all that the better managers need to do is…almost nothing. They don’t need to change their models or lower their fees as they are right priced and at the right performance already.
They just need to be ready to take on more clients. And to win clients all they need to be is open and transparent, as this is what stimulates price competition. Admittedly, it’s a tough ask of managers…be open about pricing…but it’s the way to success.
Now can I prove any of this? The answer is yes. Last year, when ClearGlass really got going with benchmarking, we helped over 50 institutional asset owner clients identify an average of 8bps of fee saving, just as predicted. Our aim this year is to do the same for the rest. This is a total annual fee saving of £1-2bn of annually repeatable savings for DB schemes in the UK.
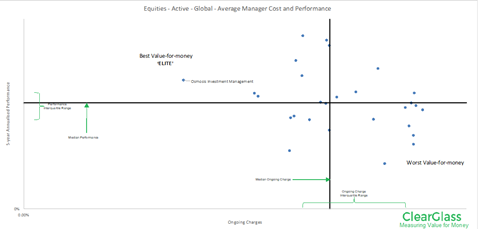
But what about asset managers – is the opportunity for them real and provable? At the start of 2023 we carried out a benchmarking exercise for Osmosis Investment Management, a boutique environmental active equity manager, and showed that they not only stand alone in the ESG-space in terms of performance and cost (i.e. excellent VfM), but when compared to a wider non-impact active equity market they are still ‘elite’ (ClearGlass nomenclature for simultaneously best quartile ongoing charges and five-year annualised performance – see FIG. 1).
Figure 1: Value-for-Money plot for active equity managers. Each datapoint is one fund manager, and a datapoint represents the median value for oncoing charges and five-year net performance for all portfolios in the ClearGlass database for that manager.
And since proving this they have won several new clients. Over €5bn of assets have been onboarded by Osmosis since December 2022. But Osmosis is the beginning of a long journey to a properly competitive market, a market where price competition is real and managers win assets by dint of providing excellent VfM and being able to prove it.
The new UK Consumer Duty regulations will be immensely helpful, most especially when managers have to pro-actively prove they are providing good, comparative VfM. This will probably be when the UK’s Assessment of Value framework, or something similar, is ported from the authorised fund space to the institutional space.
The major difference here being that for authorised funds, cost data is at share-class level, as retail clients all get the same price (unless a platform is offering a discount, of course).
In the institutional fund space, every deal is individually negotiated to a point that is unique for every single client. To produce Assessment of Value charts for institutional clients therefore requires a single client’s price point to be compared to a benchmark derived only from client-specific deal data and not from share-class-level data. And that means using data collected using the CTI standard.
Chris Sier is CEO of ClearGlass Analytics, an independent cost transparency data provider


![Ewan McCulloch (7)[33]](https://d3ese01zxankcs.cloudfront.net/Pictures/380x253/6/1/3/138613_ewanmcculloch733_634858_crop.jpg)