


Many investors believe markets to be cyclical and search for signs of cycles in an attempt to predict which investment styles are coming into and out of favour
People have a tendency to see patterns where they do not exist.1 Do a Google image search for “#iseefaces” and you will understand what I mean.
This can be a problem for investors because it is one thing to interpret a startled expression in a bowling ball or a light switch, and another to think that historical stock market data can help predict the future.
Many investors believe markets to be cyclical and search for signs of cycles in an attempt to predict which investment styles are coming into and out of favour. Rolling stock returns are like a Venus flytrap for these investors, luring them to the illusion of a pattern where one may not exist.
Multi-year returns expressed over overlapping, rolling periods appear cyclical because consecutive observations share many data points. For example, a five-year rolling return computed at the end of June has 59 out of 60 data points in common with the end-of-July five-year return.
This rolling performance obscures the volatility in stock returns, in this case month-to-month, that would otherwise impede predictability.
Another reason investors may believe in market cyclicality is because it shows up in economic data. Measures such as GDP growth, inflation, and employment are relatively slow-moving and therefore their values in any one period are strongly related to their values in the preceding and following periods. The relations between periods is referred to as autocorrelation.
Changes in stock market prices, on the other hand, are fast-moving. As such, autocorrelation of stock returns is negligible. One period’s return tells you almost nothing about the next. This is the central idea of Burton Malkiel’s 1973 book, A Random Walk Down Wall Street.
We can measure autocorrelation through the proportion of Russell 3000 index returns explained by past return observations.
As shown in figure 1, a regression of the index’s monthly returns on the return in the preceding month finds that consecutive monthly returns have almost no correlation. In technical terms, the so-called autoregressive model produces an R-squared3 of just 0.2%, meaning just a fraction of each month’s returns could be explained by the month preceding.
However, rolling returns measured each month are highly correlated with the rolling return observed the following month – the percent of variation explained, or R-squared, ranged from 82.7% using 12-month returns to 96% for five-year returns.
These values stand in stark contrast to the regressions of non-overlapping, rolling returns, for which consecutive observations are totally independent.
Figure 1
Proportion of Russell 3000 Index return explained by its return in the preceding period

The strong autocorrelation of rolling, overlapping returns produces a cyclical appearance. We can even demonstrate this using a series of returns drawn at random from a normal distribution. Because they were selected at random, we know there is no relation between them. This essentially precludes autocorrelation.
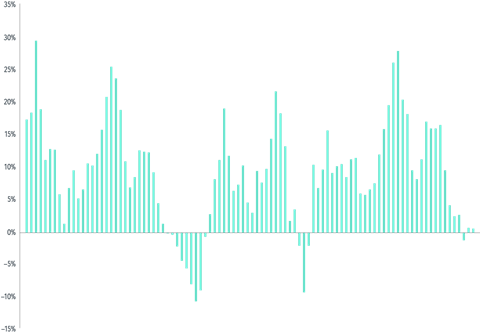
The annual returns of this simulated series, illustrated in the top panel of figure 2, convey the randomness through an absence of any perceptible pattern. However, rolling returns in the bottom panel of figure 2 exhibit periodic waxing and waning that would seem to imply predictability.
Of course, the ‘predictability’ is just an artifact of how the same, random underlying data are presented; specifically, the overlap among consecutive observations. It appears that one year’s rolling return clearly has information about the next year’s rolling return, but this is about as insightful as me successfully guessing your name after you tell me what your name is.
Figure 2
Annual and rolling, overlapping 5-year returns for a sequence of 1,200 randomly drawn monthly returns
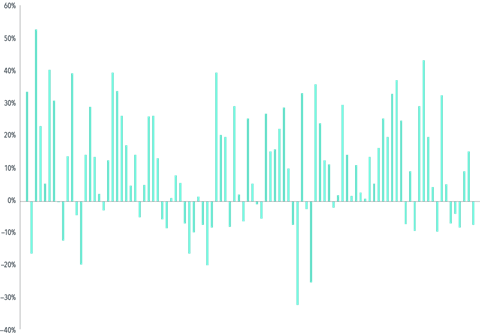
Rolling returns computed using a sequence of 1,200 returns drawn at random from a normal distribution with mean 1% and standard deviation 5%
A cyclic stock market, where one period provides useful information about what will happen in the next period, would present frequent opportunities for successful market timing. However, the paucity of outperforming active equity managers suggests predicting stock market movements is not that easy.
William Sharpe’s Arithmetic of Active Management proposed in 1991 that “after costs, the return on the average actively managed dollar will be less than the return on the average passively managed dollar”.

Fama and French tested this in 2006 in Luck versus Skill in the Cross-Section of Mutual Fund Returns and found Sharpe’s hypothesis to be true. Others have found the same in markets around the world. Yes, some managers will catch the right thing at the right time, but how do you catch them?
Cyclicality may also imply expected stock returns periodically go negative. This a difficult concept to square with a market that reflects risk and return – why would you risk your capital in the market if you did not expect a return?
Stock markets have positive expected returns every day, and research tells us the most reliable way to capture those returns is to stay invested for the long haul.
FOOTNOTE
1. Michael Shermer, “Patternicity: Finding Meaningful Patterns in Meaningless Noise,” Scientific American, December 1, 2008.